Wednesday, May 28, 2008

Case-Shiller

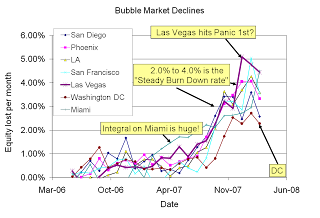
Looking at this month's Case-Shiller is almost like an expected flash back. The only new trend is that quite a few cities seem to have hit a steady decline rate.

Those approximate decline rates of housing value per month. I like to graph everything in terms of the gain/loss rate per month. What is the appreciation/depreciation?

Phoenix: 3.5% drop in value per month
LA: 3.75% decline per month
San Diego: 3.75% decline per month
DC: 2.25% decline per month


Las Vegas is an exception. Its dropped off its horrific 5%+ per month rate down to 4.5%. It seems to be searching for its decline rate.

What's up with Miami? It suddenly is increasing it decline rate. What happened? I'm familiar with Florida weather; we haven't hit the horrid weather that drives away buyers... But my articles require graphs!


Look at that trend. So much for real estate always going up!


Now let's look at the derivative.


I've already commented on how many of the cities are losing value at a near constant rate. Las Vegas is plummeting. Its just been a really bad 2008 for that city. Every month in 2008 had had Las Vegas losing value faster than the 20 other cities in Case-Shiller.

My previous comments on DC also hold. Its dropping at a lower rate than the other bubble markets. I expect it to "bottom out" at a lower afford ability than its historical norm.

I had coworkers try to tell me the bottom was only 3 months away. Look at those price curves. Look at how price momentum (up or down) tends to hold and slowly roll into a bottom. A bottom that's a long way away.

Got Popcorn?
Neil

Monday, May 26, 2008

Tribute to calculated risk


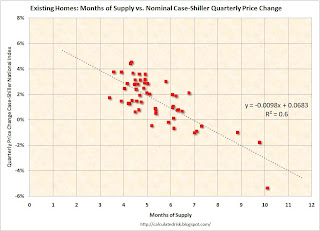
I love graphs. I love data. This graph from Calculatedrisk is worth 10,000 words.
From this article

What do I take from this?
1) 7 months of inventory is zero percent home appreciation.
2) 4 to 5 months of inventory looks to be normal from that graph...
3) +/- 2% appreciation based upon market perceptions.

I appreciate the nature of the scatter plot. Now I want to take this approach and expand it (not tonight, next year). Why? I want to see how credit availability impact the trend. Since that is a slow effect (that needs some seasonality correction)... its something to consider for now.

I'm looking forward to seeing this graph filled out with more data. Anyone else thinking the next few years will fill out the right side of the graph nicely? I'm thinking that it should also be done for a few local markets... So I'll collect the data and publish later.

Got Popcorn?
Neil

Saturday, May 24, 2008

On your Mark, Get Set...

Traditionally, we're at the start of the summer listing season. More precisely, next week should be the initial uptick in home listings. Inventory should start a 3 month climb.

Of course such comments need graphs. ;)

But I should comment. I believe we are in the "Bull trap." An event that should last into June and possibly even through July. I've made a point of not predicting the next real estate emotion change until Fall. When the in the fall? I wish I could predict that well. ;)

My first choice is to buy in the South Bay of LA.


You might comment that many of the cities the last few years didn't have a run up in inventory starting right now. Correct. Some... lag. But usually professional neighborhoods like to move around the school year.


Nationally?


What we're looking for is masked out in a Spring through Fall inventory growth. So do understand I'm 'mono-focusing' on neighborhoods where working professionals want to live.


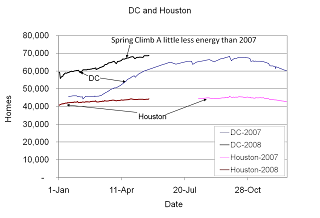
Houston seems to have almost flat annual inventory. However... I started tracking them later in the game.

DC shows a spike that is a bit more weather driven. This year the inventory climb has been 'less energetic' there than last year. I find it interesting that the inventory peaks earlier than the national trend (seasonally).


But there are cities going counter to this trend! Why? Foreclosures:
Phoenix:


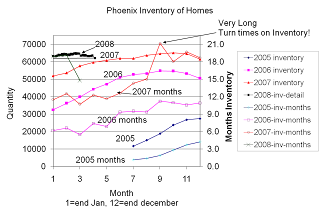
Do you recall the bubble blogs as the inventory in Phoenix broke through the new thresholds? I can recall when 40,000 was a big deal. Then 50,000... Now 60,000 is a yawn. In this bull trap, inventory has 'dropped' to a paltry 15 months. ;)


How about Las Vegas?:


A sharp drop in inventory. But wait a second... what about all those condos under construction? Well... I know two people who have left their Las Vegas homes and have given up selling them for 'less than they are worth.' In other words, shadow inventory. Could these individuals hold onto their homes for years? Yes. But its going to put a cap on any appreciation as soon as the market turns (waiting sellers will jump back into the market).


So let's see how the market develops this summer. I expect a continued 'bull trap.' But when will it end? My father strongly feels that June is when everything is likely to fall apart. Myself? I'm not as sure. I simply know we cannot get through the fall with the current economic climate without some sort of break in the housing market.

But then that gets back to how I won't buy before 2010... Be patient.

Got Popcorn?
Neil

Monday, May 19, 2008

In the steps of Morgan

In the late 1920's, JP Morgan bought a Grumman Goose to commute from Newport RI to New York. Ironically, SoCal real estate prices are so high its now cheaper to buy a distance away and commute in via aircraft!

The modern day equivalent is now available. Due to the extreme home prices in Santa Monica, its now cheaper to buy a jet and fly in daily than it is to purchase a nice home in Santa Monica. I speak of the Eclipse 500, with its $400/hour operating costs (less if you self pilot, more if you insist on twin pilots). I wouldn't spend $1.2M to buy one, rather it would be wiser to purchase a fractional ownership and pay per hour costs. Why not. You fly 8am to 8:30am in, and then someone else rents the thing to fly in/out and then another aircraft is ready for you at 5/6/7pm (whatever your normal work day is).


During the last bubble, quite a few of my coworkers started to commute via aircraft. They bought homes out in the IE around an airfield. But note: it was almost an excuse with their wives to be able to buy planes. ;) But they did it and have never regretted the decision. Ok, they carpool at today's oil prices, but otherwise this decision has been to maximize their stick time. Now home prices are so out of hand it is economical to commute via prop plane. For high end buyers, via jet!

This market has a long way to go until its sane.

Ps: I'm happy the FAA stepped in and kept jets at the Santa Monica airport. Killing off transportation kills off business.

Got Popcorn?
Neil

Saturday, May 17, 2008

Best Wishes to those in China

I've been swamped at work so I just haven't had time to do proper research for an article. But I do want to extend my condolences to the earthquake zones of China. My sister in law has family there (happily safe), so its something we're following as a family.

I realize we're economic competitors with China. But I still hope they can recover quickly from this 'act of god.'

Neil

Monday, May 12, 2008

Bank Failures

Bank Failures have been really low. CR pointed out ANB Financial failed in Bentonville Arkansas. Why would that matter? To me, its because when I found out about the housing bubble in NW Arkansas, it finally struck me that this was a global phenomenon. I had already known about Spain and Australia, but for some reason having an obscure corner of the US bubble made me understand the global scope of the bubble.

Updated CR article

original CR article

Now Bentonville is the headquarters of Walmart. Until a few years ago, Walmart was expanding there so quickly, that flipping real estate was a sure fire way to make money. But Walmart hasn't been expanding very quickly domestically for about 3 years! So quite a few stuck flippers.

$214 million for the FDIC is chump change. But look at the image. This bank failure will consume about a week's worth of collections by the FDIC. If we go into a deep recession, we'll once again find the FDIC under-capitalized. :( This is why I have ranted about loose lending. The mistakes of the past are coming home. Can we pay for them all?


Bank failures are certainly a lagging indicator. But it is also a driving factor (bank failures tighten up credit).

Got Popcorn?
Neil

Sunday, May 04, 2008

Quiet before the summer storm?

This is the time of year that the real estate market is in a transition from the Spring selling season to the summer selling season. Typically, 'knowledge workers' surge to put their homes on the market starting two weeks before school lets out to a few weeks after school lets out. So there is typically an inventory lull right now. A break if you will and we're seeing that in all of the inventory.

Sales data comes out next week and the week after. So I'm not going to discuss that as much as I planned. Basically, the forward looking indicators are up compared to a month ago. I still believe the stats are not pretty... But as best I can tell we're taking a few branches off the fall from the ugly tree; in other words, the market isn't pretty, but the fund injections seem to have delayed the day of reckoning from the inventory side.

Can we afford homes by historical standards?
Let's start by looking at afford ability. Wells Fargo has been calculating this the same way for an extended period of time. Search through their archives and you can find data going back decades:
http://www.nahb.org/page.aspx/category/sectionID=135


Some areas are improving in the sustainability of homes. But none are back at the historical norm. If you look at the link, median incomes have gone up only gone up a bit since 2000.

Now what about Case-Shiller?


You can see that by historical measures, prices are still high but as a group everything is falling. There is not one city in the 20 monitored that hasn't lost value in the last six months. Only three remain at 200% or more of their January 2000 prices. To think, incomes have only gone up by ~20%... That implies more correction is required. Some of the 'less bubbly' areas saw incomes remain flat, so that isn't necessarily good.

I like to plot the trend of price drops per month in a number of markets. What we see is a flattening off in the price drops. Basically in the 2.0% to 4.0% range with two outliers in Las Vegas and the Bay Area. I could only speculate on the SF Bay Area at this point. Las Vegas is so overbuilt that it was doomed to an extraordinary collapse.

But notice something about DC. Of the large markets identified as bubble markets, it looks like it is having the least pain. Its quite possible that it has matured into a large enough urban area that the fraction of the population that can afford a home has dropped (a la LA, NYC, and the bay area). I could only speculate on where its final affordability plateau will be; but I do not expect it to ever hit 80% again! (Yes, a bear stating a city might have moved to a new threshold.) Where? Its not ready to hit LA's 50% upper bound. Not this cycle. Perhaps prices will stop their decent at 60% to 70% affordability.

But then consider LA... If any city has a risk of breaking the pattern and going to very fast price declines, it would be the least affordable city in the nation (world?).


National Inventory

Its ugly, but it hasn't yet broken into uncharted territory. Its unseasonal... and scary. Note: Ziprealty only covers about 1/3rd of the homes for sale.


LA, in the south Bay


Inventory isn't break away... but its high. This is a classic area where traditionally the inventory builds up pretty quickly as the kids are about to leave school. So now that I know to look for that phenomenon... I'll make sure to get a few data points a week this year! I'm amazed at how fast home prices have been dropping despite inventory not being as super high levels. I think that single digit affordability and banks now having to verify loan qualifications might just be doing the damage. Probably the same effect is being seen in the SF Bay Area.


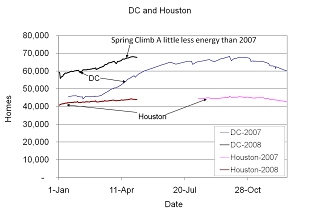
DC and Houston

Houston is easier: Its income has been flat for 7 years, but so were prices (ok, Dallas is up 20%... Nearest city in Case-Shiller)

DC has high inventory too. But the distribution is interesting. I project that 2.5% to 3.0% price declines per month will be standard for a while until afford ability breaks 50%.


Arlington

What about that distribution of inventory? Its still high inside the beltway. I pick Arlington because ziprealty data and MRIS data align (they do not for Alexandria city).


The inventory would be high on its own, but not extreme. But there is that large outside the beltway inventory that is becoming attractively priced. This is worth watching.

Phoenix

Phoenix was late to the game, shot up quickly, and is now plunging back down to earth. While the mega inventory is no longer flirting with multi-year levels, until Phoenix can pull inventory below a year, its price declines will continue to hover at high levels. But afford ability is lurking. The big unknown with Phoenix is that so much of its employment is tied to growth. With another year of slowing growth ahead... do we have a death spiral a la Las Vegas?


That's it for this weekend. (Ok, 00:20 Monday...)

In quick summary, inventory remains high, but below record levels. We're seeing the normal early May drop in inventory but we should expect to see a ramp up of inventory until the end of the summer selling season in most areas. Case-Shiller is pointing to rapid declines in similar home prices. I'll be very curious to see if there is any 'spring bounce' break in the price declines.

Overall, its a waiters market.

We're not seeing any signs of a turn around. If anything, its only evidence that the rate of pain increase has halted.

Got Popcorn?
Neil